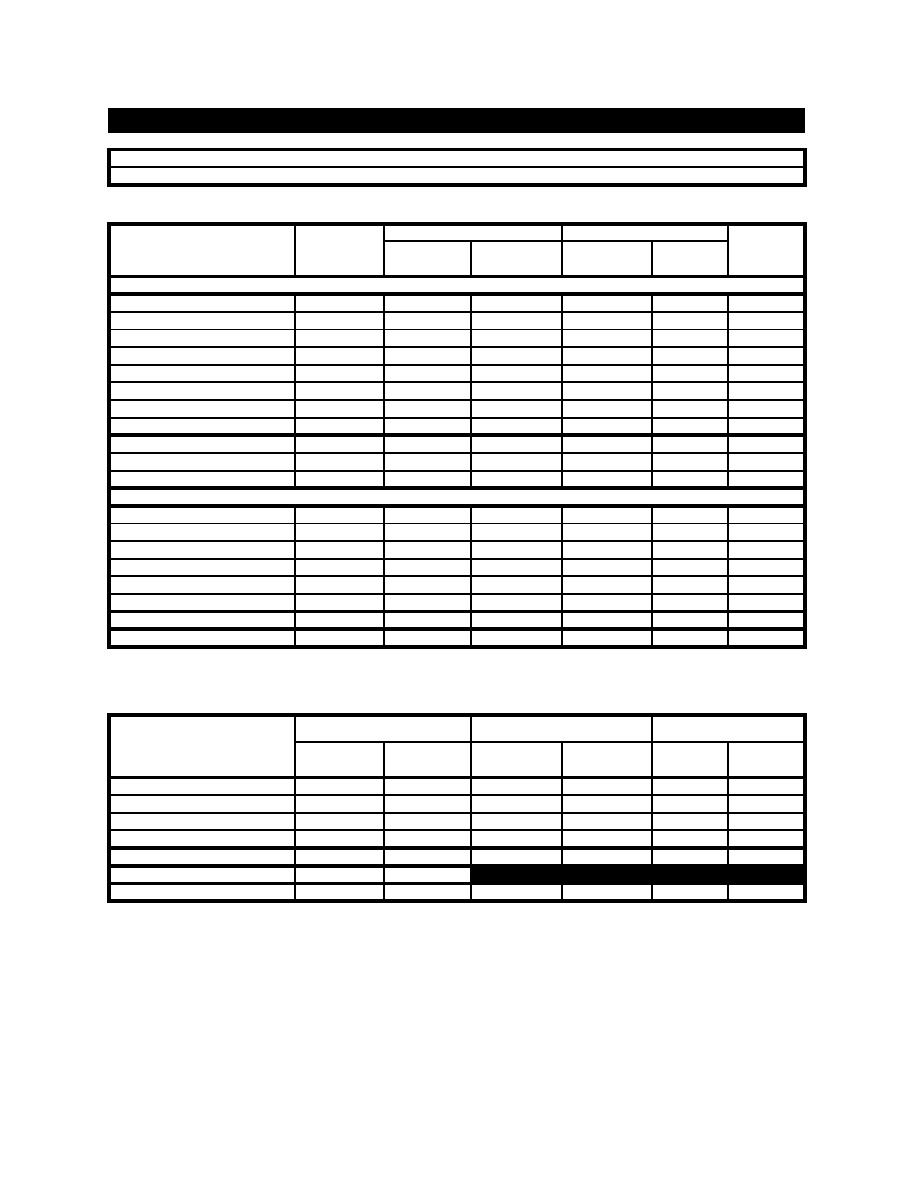
Energy Cost Budget (ECB) Compliance
Project Name:
GSA LEED Cost Study - Office - Minimal Facade Renovation: #5B (Gold)
Contact Person:
Energy Summary by End Use
Proposed Building
Budget Building
Proposed /
End Use
Energy Type*
Energy
Peak
Energy
Peak
Budget
3
3
3
3
Energy (%)
(10 Btu)
(10 Btu/h)
(10 Btu)
(10 Btu/h)
Regulated
Lighting - Conditioned
E
2,039,864
739
3,628,263
1033
56.2%
Space Heating (1)
E
21,311
20
28,971
20
73.6%
Space Heating (2)
NG
1,650,200
467
2,990,900
536
55.2%
Space Cooling
E
623,437
574
1,100,435
1061
56.7%
Pumps
E
132,771
66
125,927
59
105.4%
Heat Rejection
E
309,561
139
356,175
225
86.9%
Fans
E
1,669,884
882
2,424,117
792
68.9%
Service water heating
NG
194,200
16
194,200
16
100.0%
Sub-Total Regulated
6,641,228
10,848,988
61.2%
Non-Regulated/Process
Office Equipment
E
3,943,201
977
3,943,201
977
100.0%
Task Lighting
E
441,035
198
441,035
198
100.0%
Lighting - Exterior
E
156,918
34
156,918
34
100.0%
Elevators & escalators
E
163,790
115
163,790
115
100.0%
Refrigeration (food, etc.)
NA
NA
NA
NA
NA
Cooking (commercial)
NA
NA
NA
NA
NA
Sub-Total Non-Regulated/Process
4,704,943
4,704,943
100.0%
Total Building Consumption
11,346,172
15,553,931
72.9%
* E = Electricity (kWh); NG = Natural Gas (Therms or CCF); FO2 = #2 Fuel Oil (gal); FO6 = #6 Fuel Oil (gal); S = Steam (mmbtu);
CW = Chilled Water (ton-h)
Energy and Cost Summary by Fuel Type
Proposed Building
Budget Building
Proposed / Budget
(DEC'')
(ECB')
(DEC'' / ECB')
Energy
Cost
Energy
Cost
Energy
Cost
(103 Btu)
(103 Btu)
($)
($)
(%)
(%)
4,796,828
118,918
7,663,888
192,297
62.6%
61.8%
Natural Gas
1,844,400
9,507
3,185,100
16,210
57.9%
58.6%
Other Fossil Fuel
District steam
Total Nonsolar
6,641,228
128,425
10,848,988
208,507
61.2%
61.6%
Solar or site recovered
Total Including Solar
6,641,228
128,425
10,848,988
208,507
61.2%
61.6%
* These results use assumptions for showing compliance during a typical year; actual energy costs may be substantially different.
Percent Savings = (ECB' $ - DEC'' $)/ECB' $ =
38.41%
Scale
2.1
Renovation : EA Credit 1 Points =
7
sf
kBtu/sf
Building Area
279000
40.7
GSA LEED Cost Study - Appendix J


 Previous Page
